CRM Dashboard
The CRM Dashboard delivers real-time business intelligence, executive KPI monitoring, conversion analytics, sales performance rankings, and revenue tracking.
Time Filters & Period Comparison
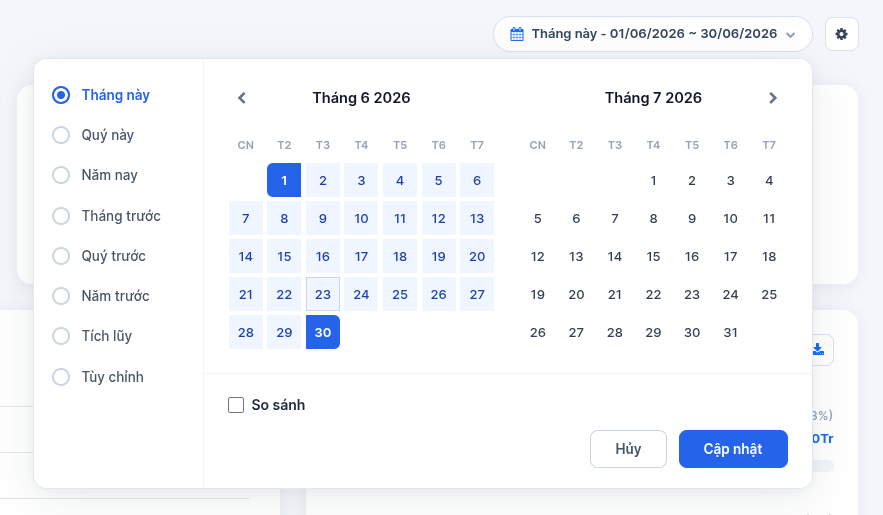
Time Filter
Select predefined ranges (This Month, Last Month, This Quarter, This Year) or set custom date intervals.
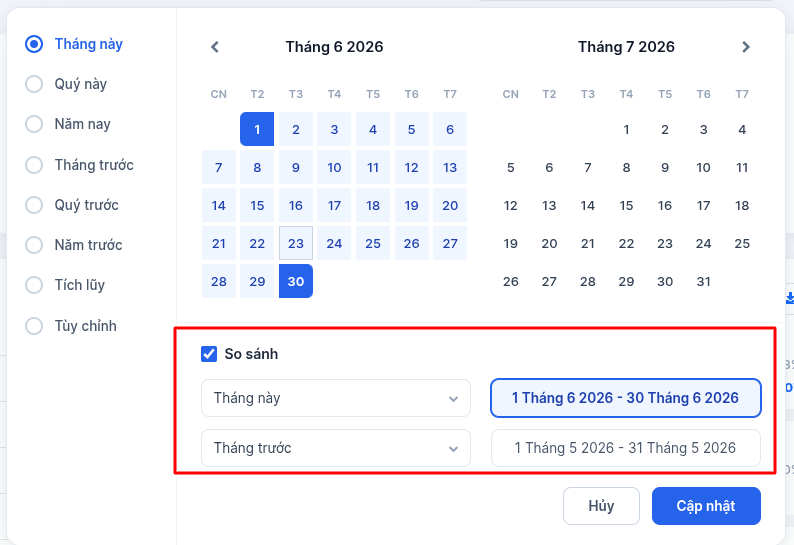
Previous Period Comparison
Toggle comparison to evaluate growth trends against previous periods.
Executive KPI Metrics
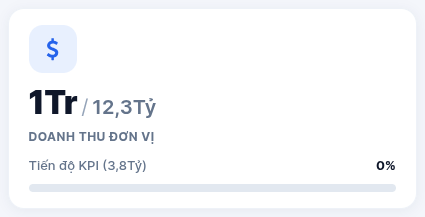
Revenue KPI Cards
Displays realized and forecasted revenue metrics across individual, team, and company levels.

Signed Contracts Metric
Monitors total contract count and value signed within the filtered cycle.


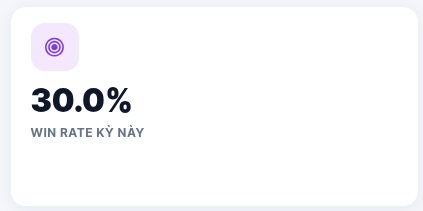
Win Rate Metric
Measures closing effectiveness:

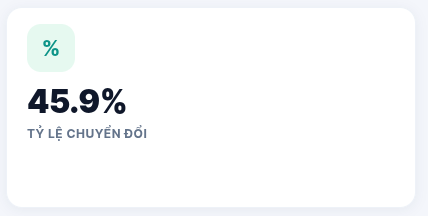
Conversion Rate Metric
Evaluates lead-to-opportunity qualification efficiency:

In-Depth Analytical Charts
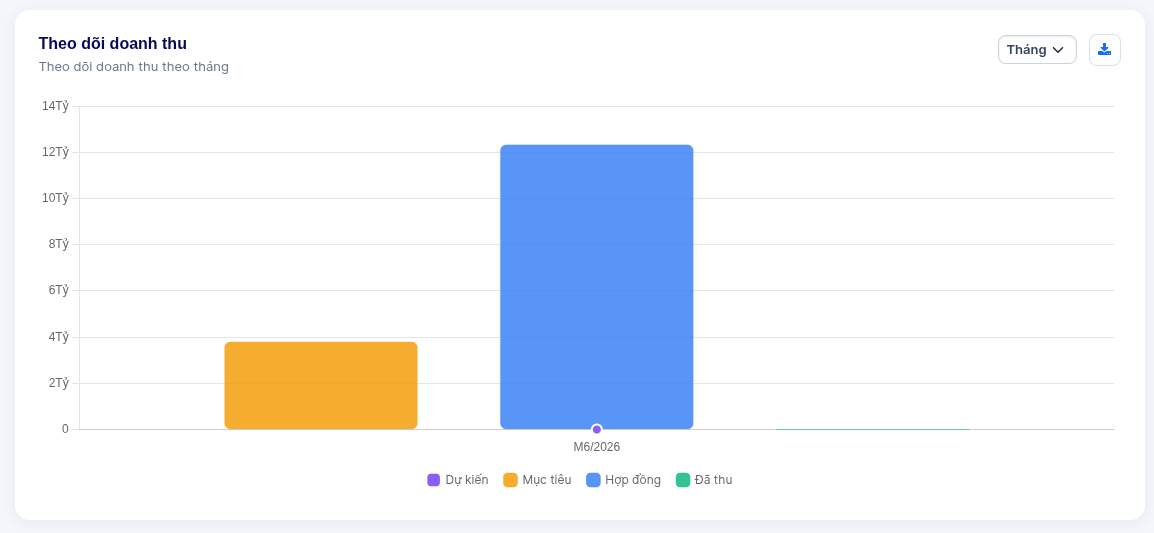
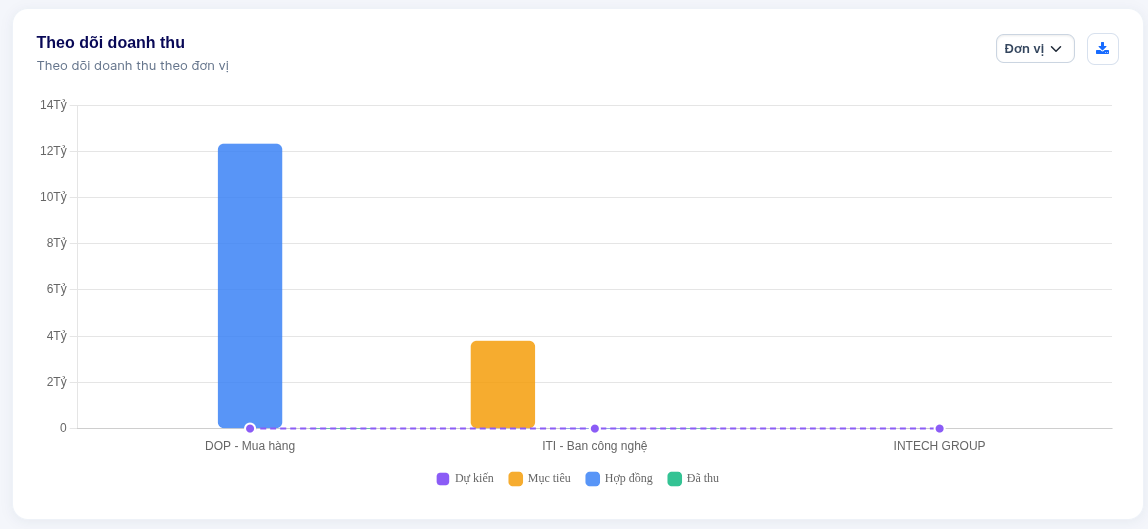
1. Revenue Tracking Chart
Compares monthly target, forecasted pipeline revenue, and actual collected revenue.

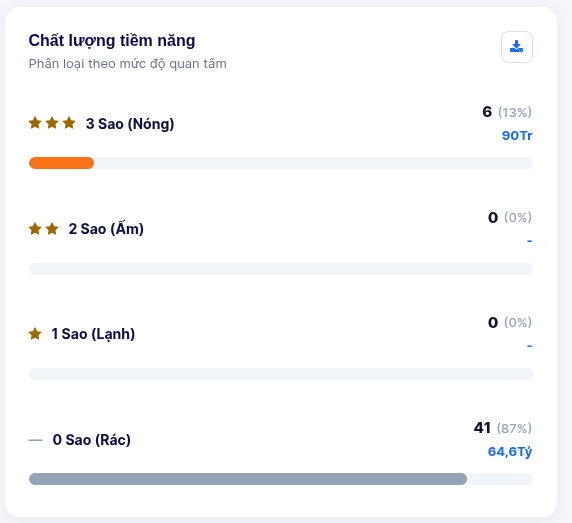
2. Lead Quality Distribution (Scoring)
Classifies pipeline volume across 0-star (Unqualified), 1-star (Cold), 2-star (Warm), and 3-star (Hot) tiers.

3. Revenue by Product Category
Analyzes sales contribution across product lines and service packages.
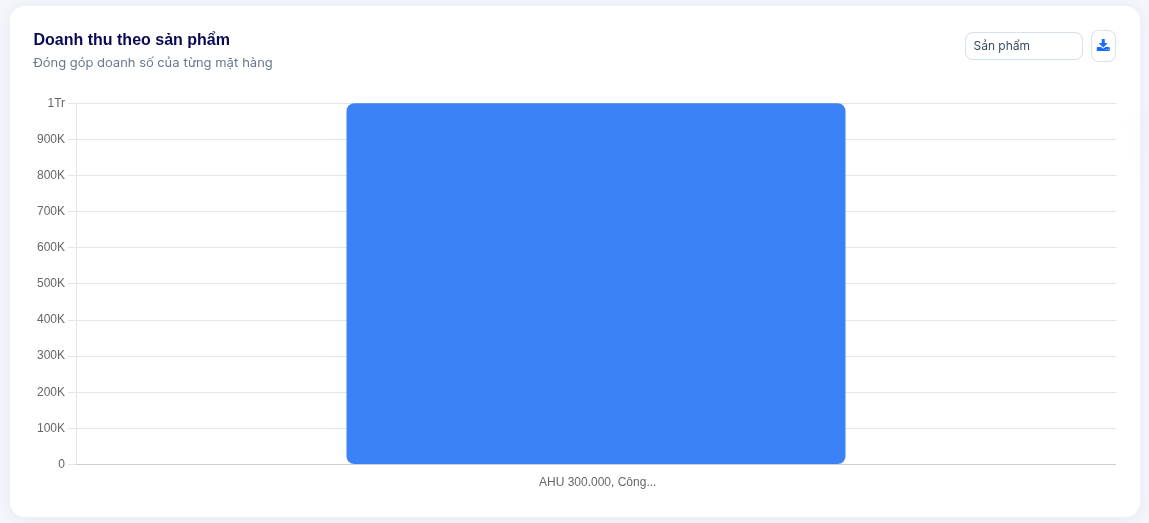

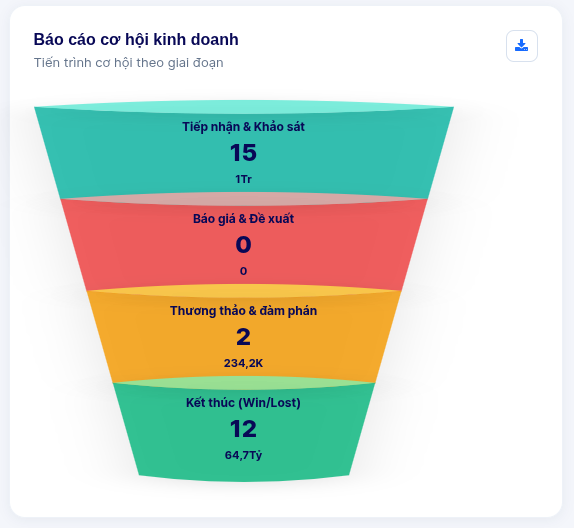
4. Sales Funnel Analytics
Visualizes stage conversion velocity and identifies bottlenecks from New to Closed Won.

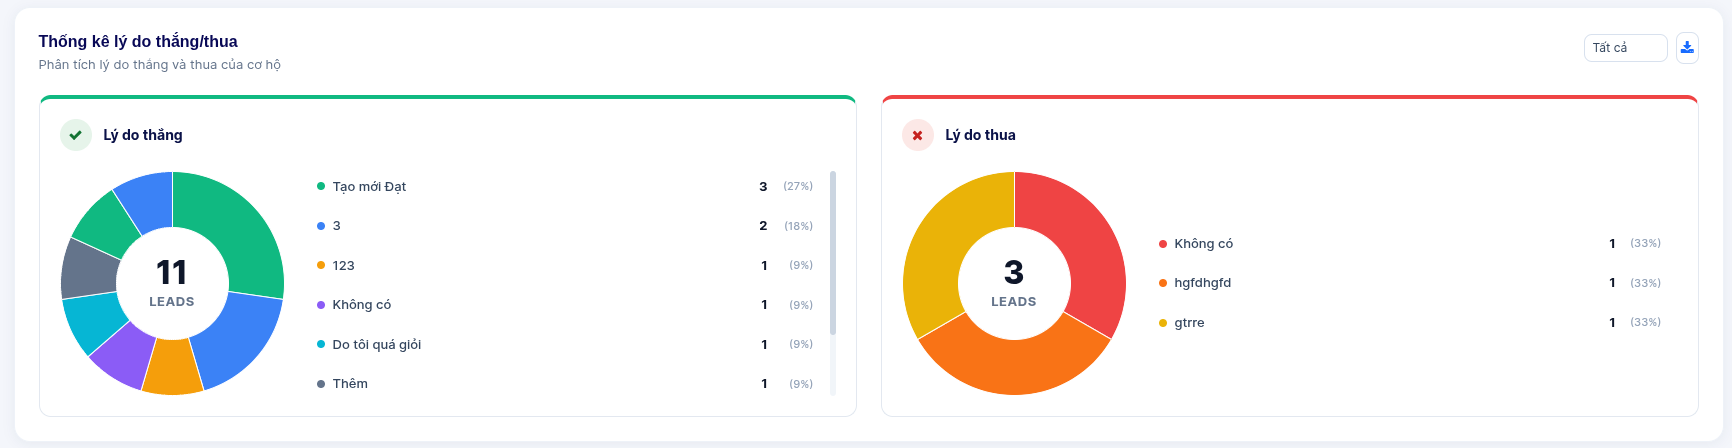
5. Win / Loss Reason Analysis
Identifies primary drivers behind won deals and lost opportunities to improve sales execution.

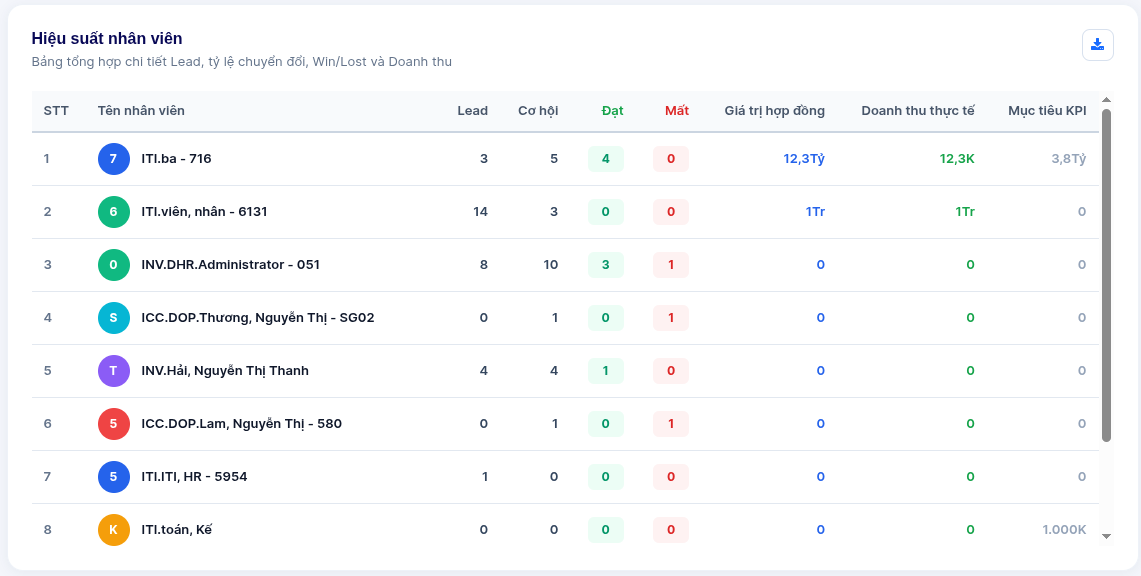
6. Sales Representative Performance Leaderboard
Ranks sales representatives by leads handled, pipeline count, won deals, signed contract value, and collected cash.

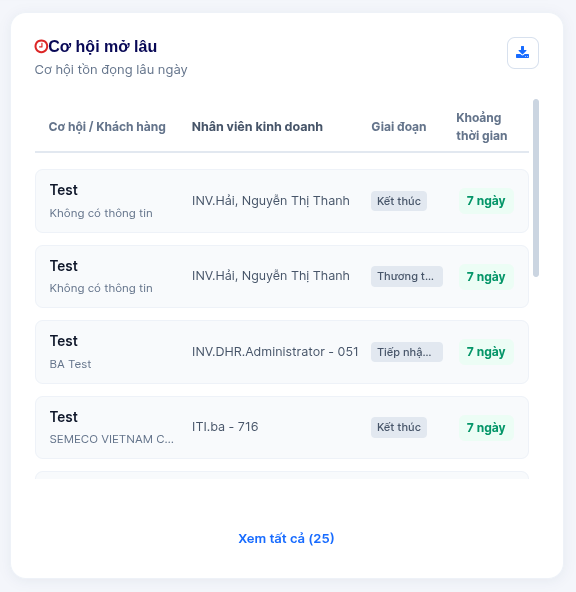
7. Aging Opportunities Watchlist
Flags deals exceeding benchmark stage durations:
Green: Under 28 days.
Yellow: 29 to 32 days.
Orange: 33 to 45 days.
Red: Over 45 days (Critical escalation).

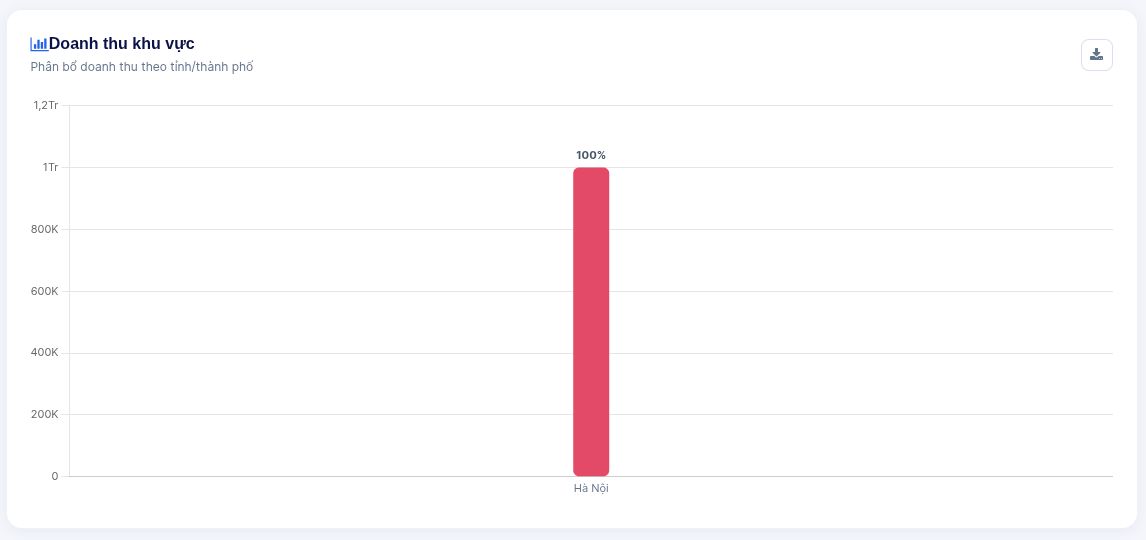
8. Regional Revenue Distribution
Geographical sales contribution mapped across provinces and economic regions.

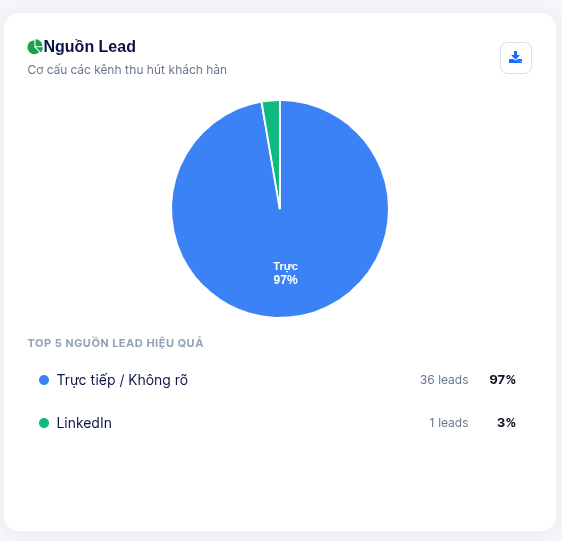
9. Lead Acquisition Channels & Source ROI
Evaluates marketing channel effectiveness across Website, Facebook, Google Ads, Events, and Referrals.

10. Subsidiary SBU Performance & Revenue Contribution
Monitors cross-subsidiary sales targets, cross-SBU shared leads, and total group revenue contributions.

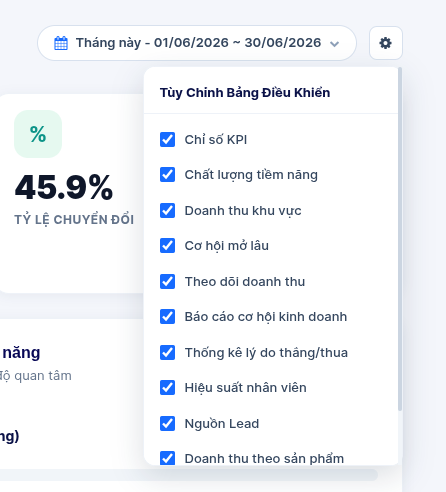
11. Customizing Dashboard Layout (Show/Hide Charts)
Users can personalize their dashboard view by toggling specific charts on or off via the configuration settings menu.