
Team performance reporting
Báo cáo Hiệu suất Đội ngũ trong ứng dụng Tuyển dụng hiển thị mỗi nhà tuyển dụng đang quản lý bao nhiêu ứng viên.
Thông tin này được xác định bởi các cá nhân điền vào trường Nhà tuyển dụng trên mỗi biểu mẫu ứng viên.
Mở báo cáo
Để truy cập báo cáo Hiệu suất Đội ngũ, điều hướng đến .
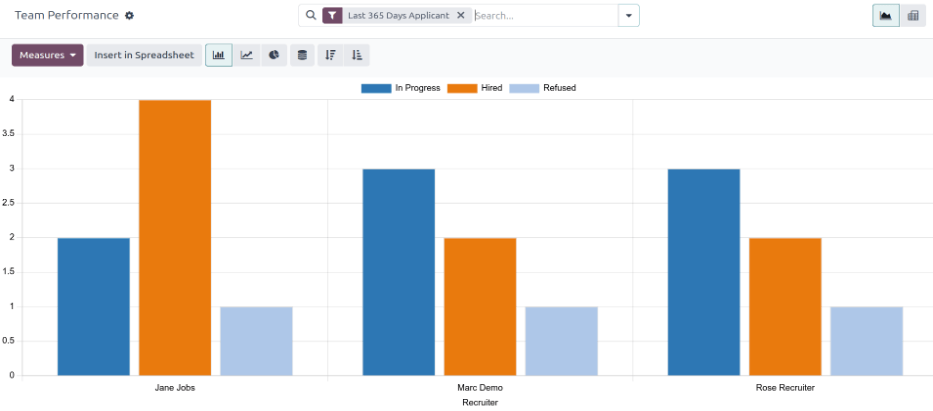
The number of In Progress, Hired, and Refused applicants for each recruiter is displayed in the (Graph) view.
Thông tin hiển thị là cho bộ lọc mặc định Ứng viên 365 Ngày Gần Nhất, như được hiển thị trong thanh tìm kiếm.
Di chuột qua bất kỳ cột nào để xem cửa sổ bật lên, hiển thị chi tiết cụ thể cho cột đó.
Chế độ xem bảng trục
Để có chế độ xem chi tiết hơn về thông tin trong báo cáo Hiệu suất Đội ngũ, nhấp vào biểu tượng Tổng hợp ở góc trên bên phải. Điều này hiển thị tất cả thông tin trong bảng tổng hợp.
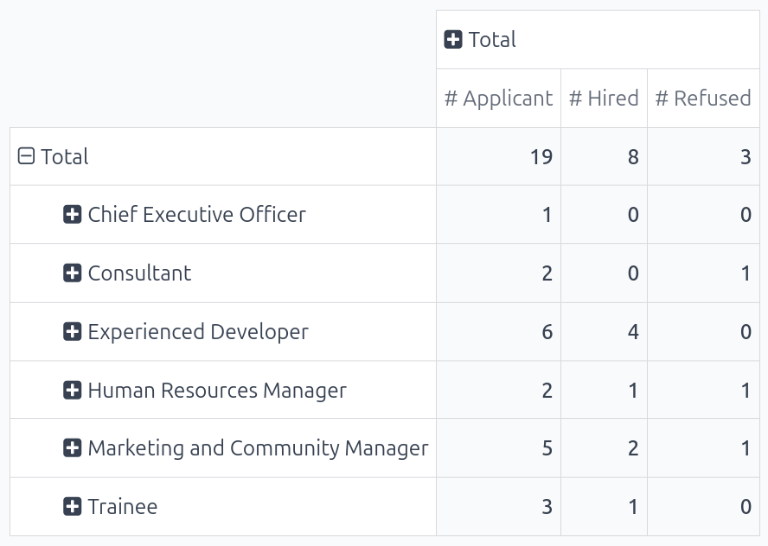
In this view, the job positions are displayed in the rows, while the columns display the total number of applicants. The applicants are further organized by # Applicant (in process), # Hired, and # Refused.
Thông tin hiển thị có thể được sửa đổi nếu muốn.
In this example, there are 19 total applicants. Out of those 19, eight have been hired, and three refused.
From the data presented, the Experienced Developer job position is the most successful. This job position has the highest number of total applicants, as well as the most hires. In addition, the Experienced Developer has the least amount of refused applicants.
This pivot table also shows that the Chief Executive Officer position is the hardest to fill, as it has the fewest total applicants.
Trường hợp sử dụng: hiệu suất của nhà tuyển dụng theo thời gian
Một cách để sửa đổi báo cáo này là hiển thị hiệu suất của các nhà tuyển dụng theo thời gian. Để hiển thị thông tin này, hãy bắt đầu với báo cáo Team Performance trong chế độ xem (Pivot).
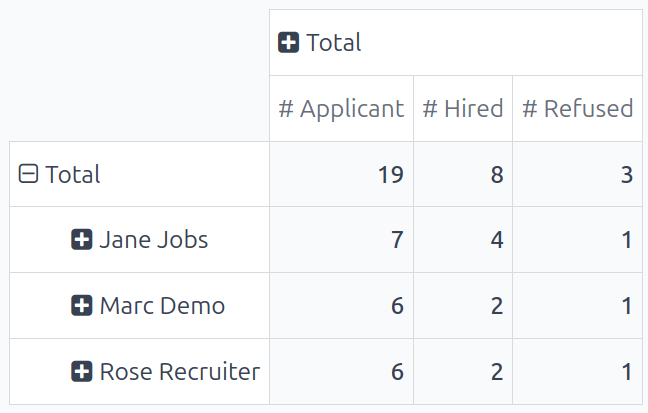
Next, click the (down arrow) in the search bar, revealing a drop-down menu. Click Add Custom Group at the bottom of the Group By column, then click Recruiter. Click away from the drop-down menu to close it. Now, each row on the table represents a recruiter.
To compare the team's performance over different time periods, click the (down arrow) in the search bar. Click Start Date in the Filters column, revealing various time periods to select.
In this example, the desired data is the comparison between the team's performance in the third quarter (June - August) and the second quarter (April - July). To do so, click Q3. Once clicked, the current year is also ticked. In this example, it is 2024.
Sau khi thực hiện lựa chọn này, cột Comparison sẽ xuất hiện. Nhấp vào Start Date: Previous Period để so sánh quý ba với quý hai cho các nhà tuyển dụng khác nhau.
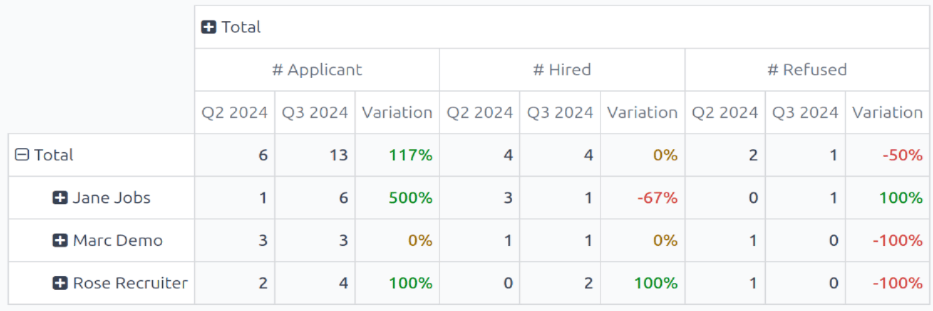
From this report, several things can be extrapolated: the total number of applicants increased, the number of hired applicants remained the same, while the number of refused applicants decreased.
Bên cạnh đó, Jane Jobs có mức tăng số lượng ứng viên cao nhất trong quý III, nhưng số ứng viên được tuyển lại giảm 67%. Nhà tuyển dụng có số liệu tổng thể tốt nhất là Rose Recruiter, người vừa tăng số ứng viên đang hoạt động lẫn ứng viên được tuyển trong quý III, đồng thời giảm số ứng viên bị từ chối.